Peptide purity testing pairs reverse-phase HPLC, which reports the main peak's share of UV peak area at about 210–220 nm, with mass spectrometry, which confirms identity by mass.
Area-percent purity assumes every component absorbs equally, but at 214 nm tryptophan absorbs about 30 times more than a peptide bond, so impurity levels can be over- or under-counted.
Electrospray ionisation produces a series of multiply charged ions; for BPC-157 (monoisotopic mass 1418.70 Da) the doubly charged ion appears near m/z 710.4.
Trifluoroacetic acid sharpens HPLC peaks but suppresses the electrospray signal, so LC-MS methods often use formic acid instead.
Neither HPLC nor intact-mass MS measures net peptide content, and neither can tell same-mass isomers apart without chromatographic separation.
Peptide purity testing normally combines two techniques. Reverse-phase HPLC with UV detection at about 210–220 nm separates the target peptide from related impurities and reports purity as the main peak's share of total peak area; mass spectrometry confirms identity by comparing the observed mass with the theoretical mass of the sequence.1 Neither measures how much of the powder is peptide, and neither on its own proves the material is exactly what the label says.
This guide explains how each method works, what the readouts mean, where the blind spots are, and what else a complete analysis includes.
Peptide purity testing at a glance
Method
Question it answers
Typical readout
Blind spots
Reverse-phase HPLC with UV detection
How pure is it?
Main-peak area % at 210–220 nm
Co-elution; unequal UV response; water and salts invisible
Mass spectrometry (ESI or MALDI)
Is it the right molecule?
Observed mass or m/z versus theoretical
Isomers share a mass; signal size is not a purity measure
LC-MS
What mass sits under each peak?
Mass spectrum for each chromatographic peak
TFA in the mobile phase suppresses the ESI signal
Tandem MS (MS/MS)
Is the sequence in the right order?
Fragment-ion ladder
Requires expert interpretation
Amino acid analysis
What is the composition, and how much peptide?
Amino acid ratios and quantity
No sequence information
Karl Fischer; ion chromatography
How much water and counter-ion?
% water; % TFA or acetate
Says nothing about identity or purity
How reverse-phase HPLC separates a peptide
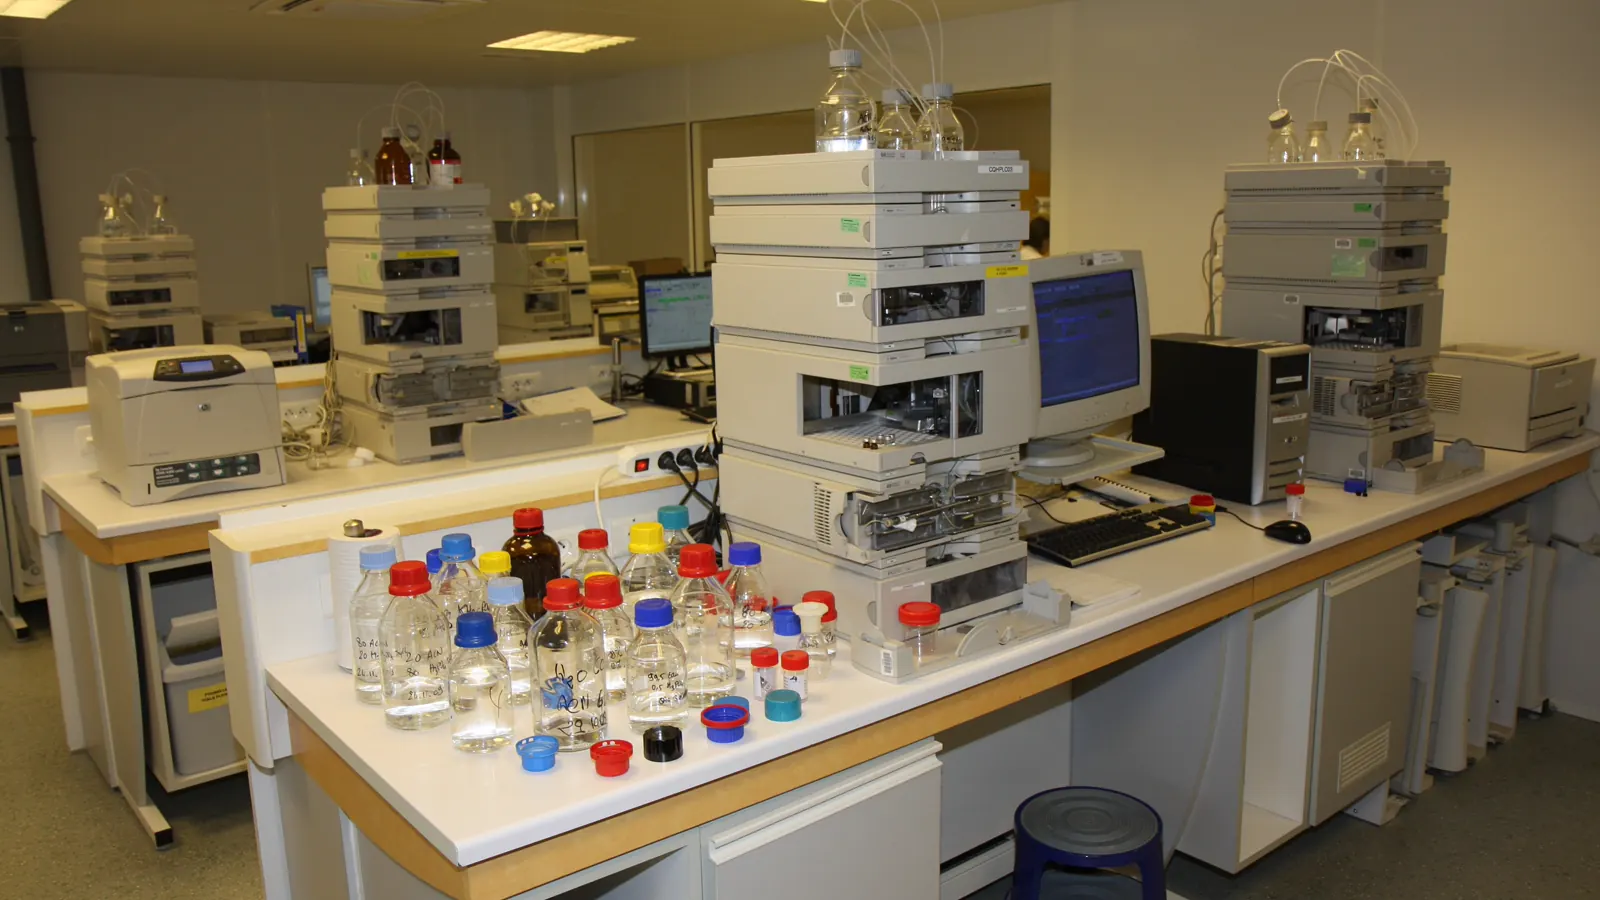
In reverse-phase HPLC (RP-HPLC), the sample is pumped through a column packed with a hydrophobic stationary phase and eluted with a gradient of increasing organic solvent. More hydrophobic molecules are retained longer, so a peptide and its near-relatives leave the column at different times. Silica-based packings remain the most widely used for peptide HPLC, and in the experience of Mant, Hodges and colleagues the best approach to most analytical peptide separations is a linear gradient from aqueous trifluoroacetic acid (TFA) to TFA in acetonitrile at about pH 2 and room temperature, with resolution tuned by the steepness of the gradient (generally 0.5–2.0% acetonitrile per minute). TFA also acts as an ion-pairing agent, which helps separate complex mixtures.2
Why detection is at 214–220 nm
The peptide bond itself absorbs in the far ultraviolet, which is why peptide purity is read at 210–220 nm.1 At 280 nm, by contrast, only peptides containing tryptophan or tyrosine absorb strongly. Kuipers and Gruppen measured the molar extinction coefficient of the peptide bond at 214 nm as 923 M⁻¹ cm⁻¹, and found that tryptophan absorbs about 30 times more strongly, while phenylalanine, tyrosine and histidine absorb about six times more.3
Reading a chromatogram
A chromatogram plots detector response against time. Purity is calculated as the area of the main peak relative to the total area of all peaks.1 On a good trace, look for a single dominant peak, small and well-separated impurity peaks, a flat baseline and stated integration settings, because the choice of which peaks to integrate changes the answer.
What HPLC purity does not prove
Equal response. Area percentage assumes every component absorbs equally per mole. Given the residue-dependent absorbance above, an impurity rich in aromatic residues is over-counted and one without them is under-counted.3
Full separation. An impurity that co-elutes with the target sits inside the main peak and inflates the purity figure.
Identity. A clean single peak says nothing about which molecule it is. That is the mass spectrometer's job.
Content. Water and counter-ions are not measured by HPLC purity, so the figure is not the fraction of the powder that is peptide.1
Reference standards and a second method
Two practices close some of these gaps. The first is co-elution with a reference sample: if the test material and an authentic standard of the same peptide give one peak when injected together, that supports identity, and Bachem lists it among its identity tests for peptides.1 The second is an orthogonal separation. Size-exclusion and ion-exchange HPLC separate peptides by size and charge rather than hydrophobicity, and Mant and colleagues describe a mixed-mode hydrophilic interaction and cation-exchange approach as a useful complement to reverse-phase HPLC.2 An impurity that hides under the main peak in one system often separates in another.
A mass spectrometer ionises molecules and measures their mass-to-charge ratio (m/z). Two soft ionisation methods dominate peptide work:
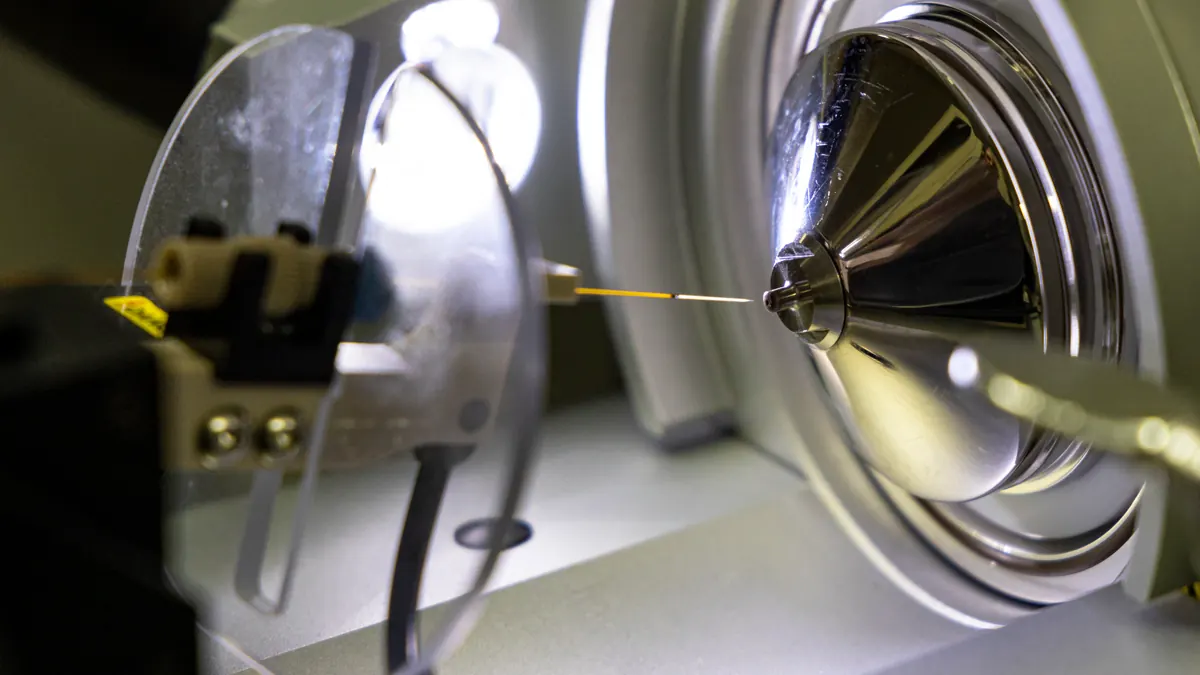
Electrospray ionisation (ESI) produces intact ions from solution. Its signature, described by Fenn and colleagues in 1989, is a coherent sequence of multiply charged ions, each differing by one charge from its neighbours.4 Software deconvolutes the series back to a single molecular mass.
Matrix-assisted laser desorption/ionisation (MALDI) ionises the sample from a crystalline matrix with a laser pulse, an approach Karas and Hillenkamp applied to proteins above 10,000 daltons in 1988.5 It is usually paired with a time-of-flight analyser and mostly produces singly charged ions, which makes its spectra simple to read.
A worked example: BPC-157
PubChem lists BPC-157 (GEPPPGKPADDAGLV) as C62H98N16O22, with a molar mass of 1419.5 g/mol and a monoisotopic mass of 1418.70 Da.6 Adding protons (1.0073 Da each) and dividing by the charge gives the ions an ESI instrument would look for:
Ion
Charge
Expected m/z
[M+H]+
1+
1419.71
[M+2H]2+
2+
710.36
[M+3H]3+
3+
473.91
An observed mass that matches within the instrument's stated accuracy supports identity; a mass that matches a different peptide means the material, or the paperwork, is not what it claims. Masses that differ from the expected value by a characteristic amount point to specific impurities, as the table further down shows. The compound itself is covered in our BPC-157 research overview, and research material is listed on the BPC-157 product page.
Isotopes, charge states and resolution
Each peak in a peptide mass spectrum is really a cluster. Carbon-13 and other heavy isotopes produce a series of peaks one mass unit apart, and on the m/z scale that spacing shrinks to 1/z: about 1.0 for a singly charged ion, 0.5 for a doubly charged ion and 0.33 for a triply charged one. Reading the spacing is how an analyst, or the software, assigns the charge state before calculating the mass. The first peak of the cluster corresponds to the monoisotopic mass; the average (molar) mass reflects the whole isotope distribution, which is why BPC-157 can be described as 1418.7 Da or 1419.5 g/mol and both figures are right. What matters is that an analytical report says which one it is quoting, and that the instrument resolved the cluster well enough to support it.
LC-MS: a mass for every peak
Coupling HPLC directly to the mass spectrometer (LC-MS) assigns a mass to each chromatographic peak, which catches co-eluting or unexpected components that UV alone would miss. There is a trade-off in the mobile phase. In a systematic comparison, TFA produced slightly narrower peaks than formic acid but significantly more suppression of the electrospray signal7, an effect attributed to ion pairing and to changes in surface tension.8 LC-MS methods therefore commonly use formic acid while UV purity methods use TFA, so the two chromatograms for one sample may not look identical.
Sequencing by tandem MS
Tandem mass spectrometry (MS/MS) isolates one ion, fragments it along the peptide backbone and reads the sequence from the ladder of fragment masses.9 It can confirm the order of residues, which an intact mass cannot: two peptides containing the same amino acids in a different order have exactly the same intact mass.
Common peptide impurities and how they show up
Most research peptides are made by solid-phase peptide synthesis (SPPS), which leaves characteristic by-products. A review of impurities in peptide medicines groups them into synthesis-related impurities (deletions and insertions of amino acids, racemisation, incompletely removed protecting groups, side-chain reactions, oxidation, dimers and oligomers, counter-ions and contamination by unrelated peptides) and degradation products (β-elimination, diketopiperazine, pyroglutamate and succinimide formation).10
Impurity
Typical origin
Mass difference from target
Best detected by
Deletion sequence
Inefficient Fmoc deprotection during SPPS
Minus one residue (for example −57.02 Da for glycine)
LC-MS
Insertion sequence
Excess amino acid reagent during SPPS
Plus one residue
LC-MS
Diastereomer
Racemisation of a residue
0 Da
HPLC separation; mass alone cannot tell
Oxidation (for example methionine sulfoxide)
Air, light or storage
+15.99 Da
LC-MS
Deamidation (Asn or Gln)
Moisture, pH and temperature
+0.98 Da
High-resolution LC-MS
Dimer
Oxidation or aggregation
About twice the mass
LC-MS; size-exclusion HPLC
Origins follow the review cited above10; mass differences are calculated from monoisotopic atomic masses. For how storage conditions drive oxidation and deamidation, see how to store peptides.
Beyond purity: content, counter-ion and endotoxin
A complete analysis also accounts for the mass that is not peptide. Bachem lists water by Karl Fischer titration, residual solvents by gas chromatography, acetate by HPLC or ion chromatography, residual TFA by ion chromatography, and nitrogen content from elemental analysis as a measure of peptide content. Amino acid analysis breaks the peptide down with strong acid and quantifies the released amino acids, confirming composition but not sequence.1 Endotoxin is measured with the bacterial endotoxins test in USP chapter <85>, which the FDA's March 2026 guidance describes as covering gel-clot, photometric and kinetic methods.11 How these results should appear on paper is covered in how to read a peptide certificate of analysis.
Peptide purity testing in Australia: questions to ask a laboratory
Which method and conditions will be used: column, mobile phase, gradient and detection wavelength?
Will you receive the chromatogram and integration report, not just a percentage?
Is identity confirmed by mass spectrometry, with the observed mass reported next to the theoretical mass?
Is a reference standard of the peptide available, or is identity inferred from mass alone?
Can the laboratory also measure net peptide content, water and counter-ion if you need them?
Is the test within the laboratory's ISO/IEC 17025 accreditation scope?
Whatever the answers, an HPLC percentage and a matching mass together show that one main component of the expected mass dominates the UV trace. On their own they do not prove the sequence, the stereochemistry or the peptide content. For how synthesis and lyophilisation produce the material being tested, see what research peptides are.
Frequently asked questions
What is HPLC peptide testing?
HPLC peptide testing separates a peptide sample on a reverse-phase column using a water-to-acetonitrile gradient, usually containing trifluoroacetic acid, and detects the components by ultraviolet absorbance at about 210–220 nm. Purity is reported as the main peak's area as a percentage of all peak areas. It shows how dominant the main component is, not its identity or how much of the powder is peptide.
How does mass spectrometry confirm a peptide?
Mass spectrometry measures the mass-to-charge ratio of ionised molecules. Electrospray ionisation gives a series of multiply charged ions that software converts into one molecular mass, while MALDI mostly gives singly charged ions. Identity is supported when the observed mass matches the theoretical mass of the sequence, and tandem MS fragments the peptide to confirm the order of its residues.
Why is peptide purity measured at 214 or 220 nm?
Because the peptide bond absorbs ultraviolet light in that region, so every peptide gives a signal there, whereas at 280 nm only peptides containing tryptophan or tyrosine absorb strongly. Absorbance at 214 nm still varies with composition: tryptophan absorbs about 30 times more than a peptide bond, and phenylalanine, tyrosine and histidine about six times more.
Can HPLC detect every impurity?
No. Impurities that co-elute with the main peak, or absorb weakly at the detection wavelength, can be missed or under-counted, and water and counter-ions are not part of the purity figure at all. Diastereomers have exactly the same mass, so mass spectrometry cannot distinguish them either; only chromatographic separation can. That is why purity, identity and content are measured separately.
What is the difference between peptide purity and peptide content?
Purity, measured by HPLC, is the share of UV-absorbing material that is the target peptide. Net peptide content is the share of the whole powder that is peptide, as opposed to non-peptide material such as water and counter-ions like trifluoroacetate. A peptide can be highly pure yet have a much lower content, so both matter when you calculate concentrations.
References
Bachem. Quality control of amino acids and peptides: a guide (Peptide Guide, chapter 7). Accessed September 2026. Source
Mant CT, Chen Y, Yan Z, et al. HPLC analysis and purification of peptides. Methods Mol Biol. 2007;386:3-55. PubMed 18604941
Kuipers BJ, Gruppen H. Prediction of molar extinction coefficients of proteins and peptides using UV absorption of the constituent amino acids at 214 nm to enable quantitative reverse phase high-performance liquid chromatography-mass spectrometry analysis. J Agric Food Chem. 2007;55(14):5445-51. PubMed 17539659
Fenn JB, Mann M, Meng CK, Wong SF, Whitehouse CM. Electrospray ionization for mass spectrometry of large biomolecules. Science. 1989;246(4926):64-71. PubMed 2675315
Karas M, Hillenkamp F. Laser desorption ionization of proteins with molecular masses exceeding 10,000 daltons. Anal Chem. 1988;60(20):2299-301. PubMed 3239801
PubChem. BPC-157 (H-GEPPPGKPADDAGLV-OH), CID 9941957. National Center for Biotechnology Information. Source
Chakraborty AB, Berger SJ. Optimization of reversed-phase peptide liquid chromatography ultraviolet mass spectrometry analyses using an automated blending methodology. J Biomol Tech. 2005;16(4):327-35. PubMed 16522853
Apffel A, Fischer S, Goldberg G, Goodley PC, Kuhlmann FE. Enhanced sensitivity for peptide mapping with electrospray liquid chromatography-mass spectrometry in the presence of signal suppression due to trifluoroacetic acid-containing mobile phases. J Chromatogr A. 1995;712(1):177-90. PubMed 8556150
Steen H, Mann M. The ABC's (and XYZ's) of peptide sequencing. Nat Rev Mol Cell Biol. 2004;5(9):699-711. PubMed 15340378
D'Hondt M, Bracke N, Taevernier L, et al. Related impurities in peptide medicines. J Pharm Biomed Anal. 2014;101:2-30. PubMed 25044089
US Food and Drug Administration. Pyrogen and endotoxins testing: questions and answers. Guidance for industry, revised March 2026. Source
Research use only. This article summarises published scientific literature
for educational purposes. It is not medical advice and does not describe or endorse human
or veterinary use. Compounds supplied by Titan Peptides are for laboratory research only
and are not approved therapeutic goods in Australia.
A section-by-section guide to reading a peptide certificate of analysis: identity, HPLC purity, net peptide content, counter-ions, water, endotoxin, and the red flags that mean a COA does not check out.
A plain-English primer on research peptides: what a peptide is, how peptides are built one amino acid at a time on a resin bead, why they arrive as a freeze-dried powder, and what "research use only" does and does not mean.
A laboratory guide to storing lyophilised and reconstituted peptides: freezer temperatures, moisture, oxidation-prone residues, light, freeze–thaw cycles and adsorption to containers.